The New GA4 Built-In Landing Page Report
Right Shout
In Uncategorized Posted December 29, 2022


Google Analytics 4 (GA4) has made the process of constructing landing page reports a whole lot easier! The new built-in functionality has enabled webmasters to instantly generate meaningful reports and review data about visits to their site. It’s an exciting development that could help those who run websites to optimize their sites for success.
Previously, users had to manually construct these types of reports – a laborious process involving multiple clicks. With the rollout of this built-in feature, everything has become so much simpler!
It’ll give a better understanding of how well your landing pages are working, so you can make informed adjustments and maximize your results.
Recently, @googleanalytics stated that landing page reports will now be available with GA4.
— Shri Kanase (@EcomShri) December 25, 2022
What this means for your eCommerce brand:
- More info on how customers are interacting with 1st page they land on
- Bounce rate increasing triggers
- Causes of low CVRs
Use data wisely. pic.twitter.com/Hu3gjtDPWT
The new Reporting Filters in GA4 are rolling out more widely.
— Charles Farina (@CharlesFarina) August 10, 2022
This feature allows you to filter/change the default reports your users see when they login to GA4.
In this example, we will create a Landing Page report for everyone and remove (not set) in the first row. pic.twitter.com/vDwShSodGw
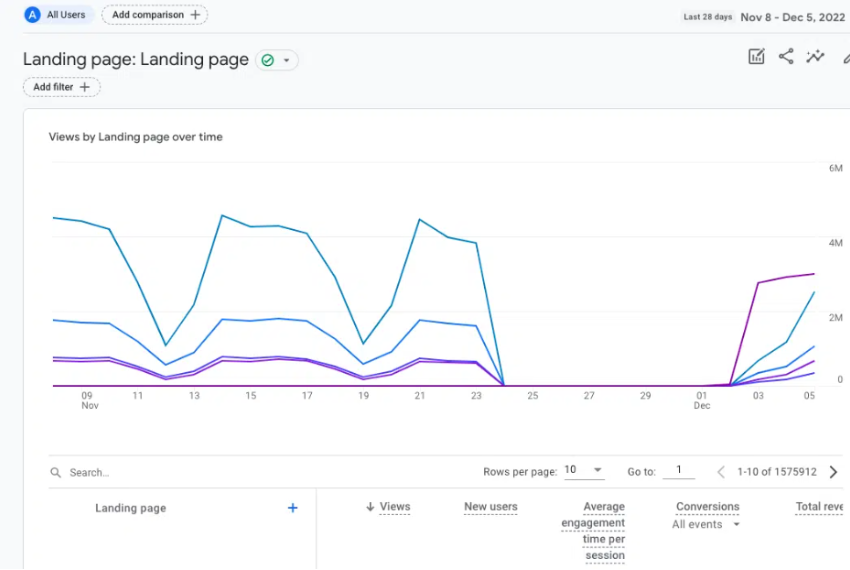
LP Reports Available in Dashboard
What’s even more impressive is that the report automatically appears in your dashboards – no manual configuration required.
Plus, it compares key metrics such as Average Engagement Time Per Session, Conversions, New Users, Views and Total Revenue to provide an accurate evaluation of page performance.
You can find the landing page report in the Engagement section of the left navigation in your GA4 dashboard.
Other New REPORT TYPES in GA4
Views per Session and Average Session Duration
Google Analytics 4 (GA4) continues to be one of the most dynamic and robust sets of digital analytics available. Recently, GA4 has added two new metrics to its capabilities – Explorations and Reporting Customization – giving users the greatest level of data analysis possible.
Average Session Duration: The average duration (in seconds) of users' sessions.
— Carly Boddy (@carly_boddy) November 30, 2022
Build reports from scratch to meet your business needs in Reporting Customization with these new metrics now available #GA4 pic.twitter.com/GZf3PcPtyS
— Carly Boddy (@carly_boddy) November 30, 2022
Hour and Date dimensions
It’s exciting to see that Google Analytics 4 now provides the hour and date dimensions! Being able to track when your customers are engaged on your website or application has always been valuable, and now you can better understand users’ interactions on a more granular level. It also unlocks new insights into which points in time your users are active. Whether it be tracking peak usage times or understanding user behavior trends associated with specific calendar dates and hours, having this extra data can be invaluable.
Hour and date dimensions now available in GA4 https://t.co/pgLsydRJg7 pic.twitter.com/Wa4ic3Dkkf
— Danny Goodwin (@MrDannyGoodwin) November 3, 2022
Introducing new date and hour dimensions in Google Analytics 4#googleanalytics #ga4https://t.co/TH7rs7N8aA pic.twitter.com/ETLto7mojo
— Anuj thaker (@Anuj_Thaker03) November 3, 2022
The new dimensions is explained in details below :
a.) Hour is the hour when an event was collected.
b.) Nth hour is the number of hours since the start of a specified date range.
c.) Date + hour is the date and hour when an event was collected.
d.) Week is the week of the event, a two-digit number from 01 to 53. Each week starts on Sunday, and January 1st is always in Week 1.
e.) Month is the month of the event, a two-digit integer from 01 to 12.
CONCLUSION
Google Analytics 4 provides more data and functionality than its past platform, Universal Analytics. The tool is designed to give users a complete understanding of their customer journey in one place. Users can see how customers interact with their businesses across devices and channels—all in near real time. Google’s newest platform also offers increased flexibility when it comes to attribution modeling. This allows businesses to better understand which marketing touchpoints are most effective in driving conversions.